Distributed Tracing for Message Broker Subscribers
This is a short tutorial on how to add end to end distributed tracing manually to your publisher subscriber. Here we use Datadog, Go or Node and RabbitMQ, but the concepts are applicable even using other distributed tracing tooling, prog language or message broker (e.g. Kafka, SQS and more)
Problem
Imagine you have a service that lets a user upload a picture then your service asynchronously creates the thumbnail through a worker. The architecture may look something like this:
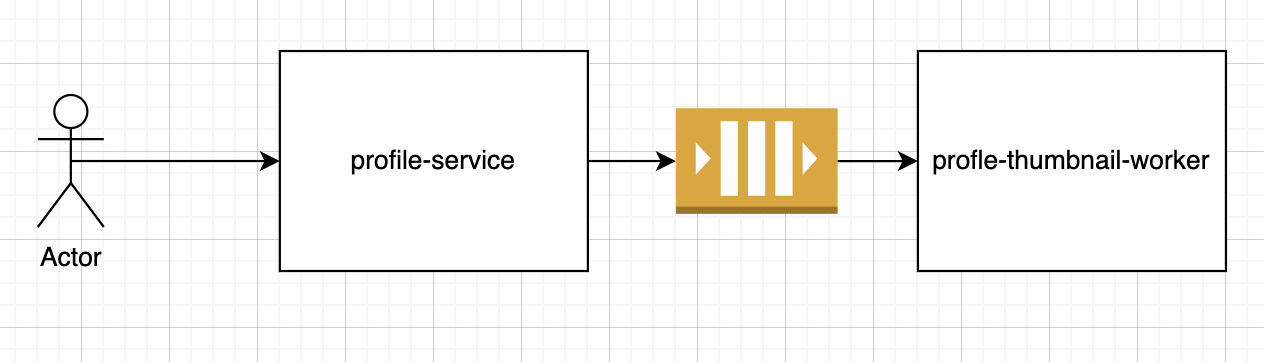
You have a web server to process the HTTP request, but offloads the creation of thumbnails to a worker through a message broker (e.g. Kafka, RabbitMQ, or SQS)
You want to have visibility, so you add distributed tracing to the web server, so you get this.
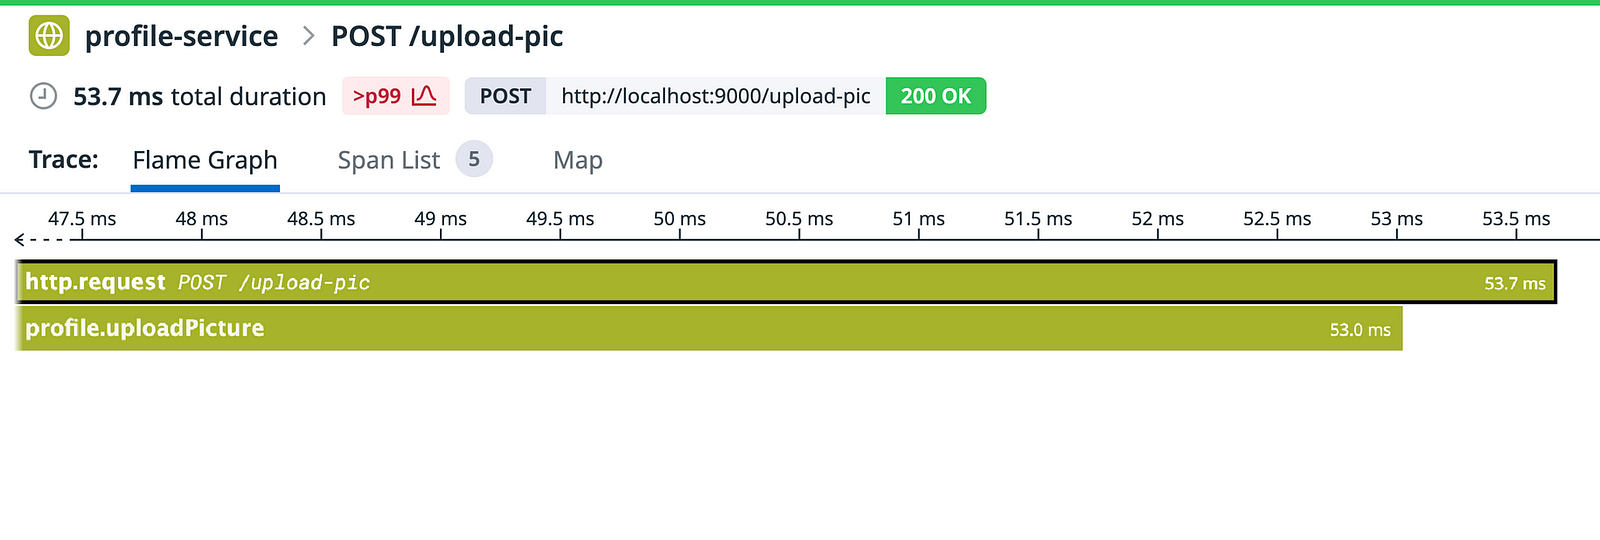
But Wait! Where is the worker that processes the thumbnails? We have no visibility for it.
This is the problem we faced in Xendit. Way back we had no visibility on our RabbitMQ Queue workers/subscribers.
Ideally, we want to see the asynchronous processing in the same trace. So we can see the cause and effect of processes in different services. This enables us to debug problems like race conditions and performance bottlenecks between different processes/workers easier and faster.
So,
How do we have a trace that spans to two services when using a message broker?
Solution
Before diving into the solution implementation, we need to understand one concept in tracing called Context Propagation
Context Propagation
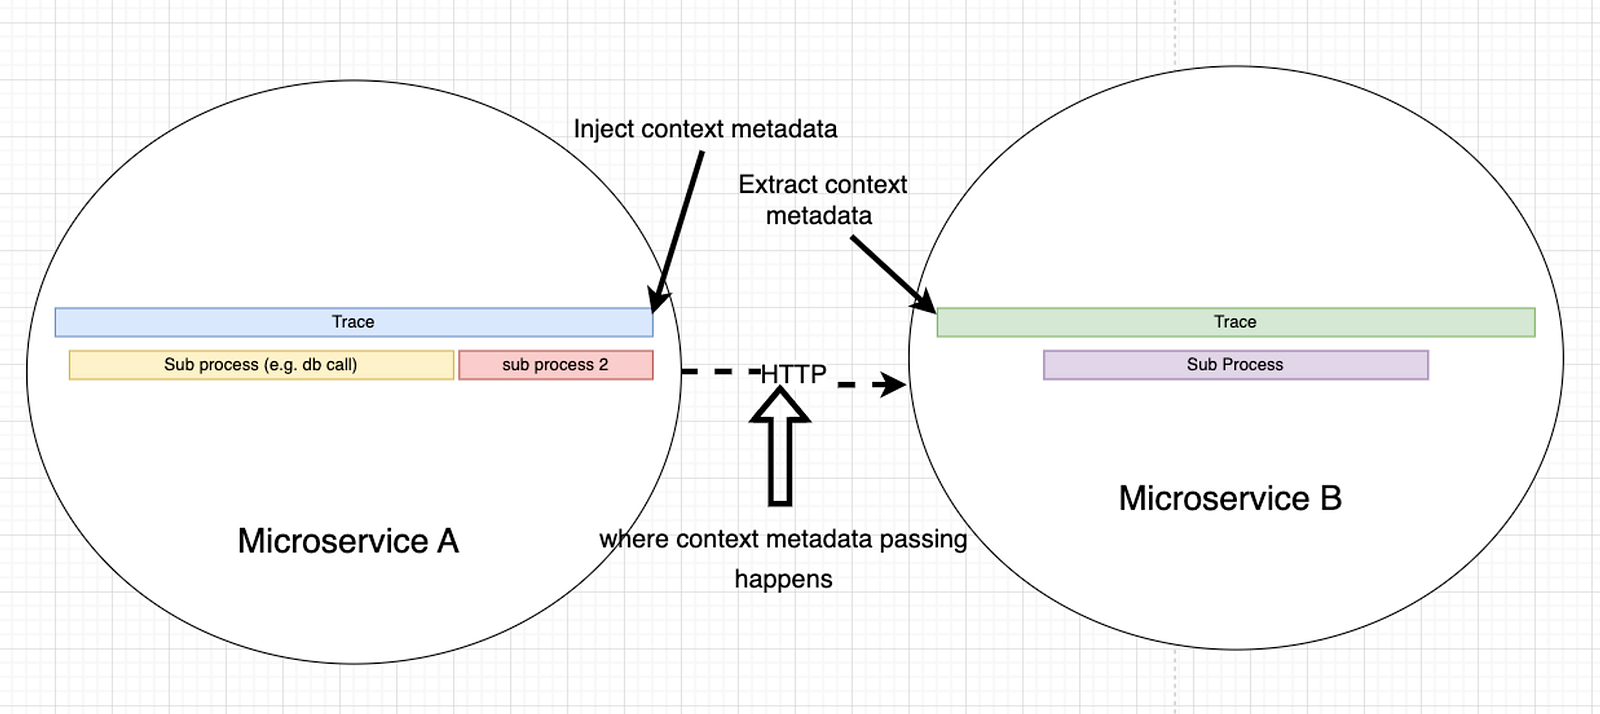
Context Propagation is the mechanism used by distributed tracing to have a trace that spans multiple services. The basic idea behind context propagation is to pass some metadata from the “source service (e.g. web server)” to the “downstream service (e.g. subscriber, queue worker, stream processing)”. The “context metadata payload” will contain a trace_id and a parentspan_id in Datadog’s case.
// Simplified metadata in json
{
   "traceID"  : "<some 64 bit unsigned int>"
   "parentID" : "<some 64 bit unsigned int>"
}
Disclaimer: Different standards have different formats. For example, Datadog uses 64 bit unsigned int, while OpenTelemetry uses 128 bit unsigned int. There is also a w3c standard https://www.w3.org/TR/trace-context/
The context metadata will be used or extracted by the downstream service before it starts its own trace. The downstream service ends up generating a span that is a child of the source service span. This process can repeat when it calls another service.
At the end of the trace, every span is then associated to a specific trace_id . Your distributed tracing provider (e.g. Datadog) or processor will process this and can now show a trace visualization.
Context Propagation
HTTP Example
To give a concrete example, if communication between service A and service B is through HTTP, then the medium to pass the context metadata is through the HTTP headers. Something like
HTTP Headers:
x-datadog-trace-id: <some 64 bit unsigned int>
x-datadog-parent-id: <some 64 bit unsigned int>
This can now be used by service B, with sample implementation in Golang using echo and Datadog shown below:
// This is a simplified version of: https://github.com/DataDog/dd-trace-go/blob/649fa0c46073774aa26429999b942eeb2841b866/contrib/internal/httptrace/httptrace.go#L26
func StartRequestSpan(r *http.Request) (tracer.Span, context.Context) {

 // Extract the context metadata from request header
  // Here HTTPHeadersCarrier is a helper type to help extract and inject trace context metadata
 if spanctx, err := tracer.Extract(tracer.HTTPHeadersCarrier(r.Header)); err == nil {
  opts = append(opts, tracer.ChildOf(spanctx))
 }
 return tracer.StartSpanFromContext(r.Context(), "http.request")

}

// Sample echo

func main() {
 e := echo.New()
 e.GET("/", func(c echo.Context) error {
  span, ctx := StartRequestSpan(c.Request()) // use the request span
    defer span.Finish() // finish span
  status := http.StatusOK
  message := "ok"
  return c.JSON(status, response{message})
 })
}
In Node using express and Datadog,
// Simplified version: https://github.com/DataDog/dd-trace-js/blob/b9121d8fc4e12819e89c41deb12ad203983f25a3/packages/dd-trace/src/plugins/util/web.js#L250-L256
function traceRequestSpan(tracer, headers) {
  // Extract
  const childOf = tracer.scope().active() || tracer.extract(FORMAT_HTTP_HEADERS, headers)

  const span = tracer.startSpan(name, { childOf })
  return span
}


const app = express()

app.get('/', (req, res) => {
 const span = traceRequestSpan(tracer, req.headers)
 res.status(200).send()
 span.finish()
})
Implementation
Now, we know how context propagation works in HTTP.
We can simply apply this in a different transport medium such as a RabbitMQ Message, Kafka Record, and SQS Message.
Attach it to the message’s headers.
Distilling it into the basic steps:
- Before publishing a message in service A, get the context metadata for the trace
- Attach the context metadata to the “headers” of the message (e.g. RMQ headers, Kafka Headers, SQS Headers)
- Publish the message to the message broker
- When service B receives/consumes the message, read the headers and check for context metadata
- If there is context metadata, use context metadata to start a trace
Below is how it can be done in Go and Node for AMQP
Go
Publisher (e.g. web/HTTP server) will have:
// Publisher.go

import (
 "gopkg.in/DataDog/dd-trace-go.v1/ddtrace/tracer"
)

func (amqpPublisher *AMQPPublisher) PublishMessage(
 ctx context.Context,
 topic string,
 headers Headers,
 content interface{}
) (error) {
 span, ctx := StartPublishSpan(ctx, headers, topic)
  err := amqpPublisher.Publish( // some args )
 if err != nil {
  span.Finish(tracer.Error(err))
    return err
 }
 return nil
}

type Headers map[string]interface{}

var _ interface {
 tracer.TextMapReader
 tracer.TextMapWriter
} = (*Headers)(nil)

// Set implements TextMapWriter for Datadog Trace Extraction
func (headers Headers) Set(key, val string) {
 headers[key] = val
}

// ForeachKey conforms to the TextMapReader for Datadog Trace Extraction
func (headers Headers) ForeachKey(handler func(key, val string) error) error {
 for k, v := range headers {
  str, _ := v.(string)
  if err := handler(k, str); err != nil {
   return err
  }
 }

 return nil
}


func StartPublishSpan(
 ctx context.Context,
 headers Headers,
 resourceName string,
 opts ...tracer.StartSpanOption,
) (tracer.Span, context.Context) {
 span, ok := tracer.SpanFromContext(ctx)
 if ok {
  // Inject the context metadata. Headers need to "implement" TextMapReader TextMapWriter
  if err := tracer.Inject(span.Context(), headers); err != nil {
   log.Printf("Failed to inject span context to headers: %v", err)
  }
 }

 return tracer.StartSpanFromContext(ctx, "amqp.publish", tracer.ResourceName(resourceName))
}
Subscriber (e.g. queue worker or stream processor) will have:
// Subscriber.go

import (
 "gopkg.in/DataDog/dd-trace-go.v1/ddtrace/tracer"
)

func StartConsumeHandlerSpan(
 ctx context.Context,
 headers Headers,
 topic string,
) (context.Context, tracer.Span) {
 // Same logic. Extract context metadata. "Extract" returns a SpanContext containing the metadata
 spanCtx, err := ddtracer.Extract(headers)
 if err != nil {
  log.Print("Failed to extract span context from headers")
 }

 opts := []ddtracer.StartSpanOption{
  ddtracer.ResourceName(topic),
  ddtracer.SpanType(ext.SpanTypeMessageConsumer),
 }
 if spanCtx != nil {
  // Use span context
  opts = append(opts, ddtracer.ChildOf(spanCtx))
 }

 ddspan := ddtracer.StartSpan(
  "amqp.consumeHandler",
  opts...,
 )

 span := ddtracer.NewSpan(ddspan)
 return ddtracer.ContextWithSpan(ctx, ddspan), span
}

func (amqpSubscriber *AMQPSubscriber) MessageHandler(
 ctx context.Context,
  message Message,
) (error) {
 span, ctx := StartConsumeHandlerSpan(ctx, message.Headers, message.Topic)
  // Insert: Processing business logic
  // ....
  // ....
 if err != nil {
  span.Finish(tracer.Error(err))
    return err
 }
 return nil

}
Node
Publisher (e.g. web/http server) will have:
class Publisher {
   public async publish(message: Message): Promise<void> {
     const span = this.tracer.startSpan('amqp.publish')
     this.tracer.inject(span, 'text_map', message.headers)
     await amqplib.publish(message)
     span.finish()
    }
}
Subscriber (e.g. queue worker or stream processor) will have:
class Subscriber {
 public async messageHandler(message: Message): Promise<void> {
  const headers = msg?.properties?.headers
  const childOf = this.tracer.extract('text_map', headers);
    await this.tracer.trace(
      `amqp.consumeHandler`,
      {
        ...(childOf ? { childOf } : {}),
        tags: {
          span: {
            kind: 'consumer'
          },
        }
      },
      () => {
     // Insert: Processing business logic
     // ....
     // ....
      }
    );
  }
}
What you end up having is this if you fully implement the above:
As you can see there is an amqp.consumeHandler that happens after the http.request. . There is also a amqp.publish span to show the publishing process. Now, you can easily debug if there is a problem in the publishing operation and most importantly in the async processing part.
Conclusion
Adding Custom Instrumentation (aka adding Distributed Tracing manually) to your system, isn’t that difficult if you understand context propagation, your distributed tracing provider’s lib, and especially your system components. You can add distributed tracing to any component you programmatically build.
For Xendit, having End to End Distributed Tracing even in our async processes increased engineering teams’ confidence in deploying reliable consumers/subscribers. We found issues before customers and fixed the root cause faster during high-pressure and difficult fires.